- What is pandas groupby function?
- Example of data for using groupby()
- Splitting data into groups in pandas groupby
- Creating group based on one column
- Creating group of two columns
- Grouping by three columns
- Getting a specific group
- Groupby output format
- Iterating through groups in pandas groupby
- Finding the percentage of grouped data
- Different built-in functions
- Aggregation
- Filtering
- Transformation
- Apply
- Saving grouped DataFrame in different formats
- Summary
What is pandas groupby function? #
The pandas groupby method is a powerful and multifunctional operation in Python. It allows us to divide our data into separate groups applying various functions over these parts and combining the results. This can be used to deal with a large amount of data to perform different computations on them.
In this tutorial, we will cover splitting of data, a grouping of data, and selecting data from pandas groupby and by the end, you will have a solid knowledge of pandas groupby, you can easily apply this method on your dataset and save your groupby as CSV and Excel files.
As part of this tutorial, we will use a CSV file with not so much data for training purposes. You can download this file later and practice on your own.
Example of data for using groupby() #
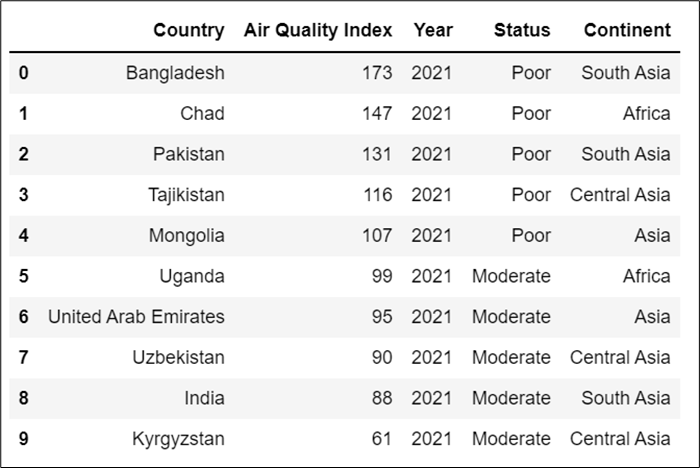
Our dataset csv file (AQ.csv) contains the following data:
Country,Air Quality Index,Year,Status,Continent
Bangladesh,173,2021,Poor,South Asia
Chad,147,2021,Poor,Africa
Pakistan,131,2021,Poor,South Asia
Tajikistan,116,2021,Poor,Central Asia
Mongolia,107,2021,Poor,Asia
Uganda,99,2021,Moderate,Africa
United Arab Emirates,95,2021,Moderate,Asia
Uzbekistan,90,2021,Moderate,Central Asia
India,88,2021,Moderate,South Asia
Kyrgyzstan,61,2021,Moderate,Central Asia
Now let’s open our example CSV file and see our data using the pandas read_csv function.
# Importing pandas
import pandas as pd

# Openning our csv file
df = pd.read_csv("AQ.csv")

# Showing the content of our CSV file
df
Output:
Splitting data into groups in pandas groupby #
In the output above, we can see that we have at least three variables by which we can group our data. We can group our data by “Year”, “Status” and “Continent”. We are going to use the groupby method to group a DataFrame based on one, two, three, or more columns. To group our data by, for instance, the continent we can type df.groupby(‘Continent’) given that your DataFrame is called “df” and that the column is called “Continent”.
Creating group based on one column #
Now let’s start with the simplest example – grouping data by one column.
# Grouping data by one column
cont = df.groupby('Continent')

# Printing the dataset after using 'groupby' by 'Continent'
print(cont)
Output:
<pandas.core.groupby.generic.DataFrameGroupBy object at 0x0000018F426AC760>The result shows us that we have successfully created a group of pandas objects, but, in general, it gives us nothing. In the output, we can see that whenever we try to use the print function to see our grouped data it prints the object not the data itself inside the object.
Let’s now look at the group we just created using the ‘group method’.
# Printing the data from the object using groups method
print(cont.groups)
Output:
{'Africa': [1, 5], 'Asia': [4, 6], 'Central Asia': [3, 7, 9], 'South Asia': [0, 2, 8]}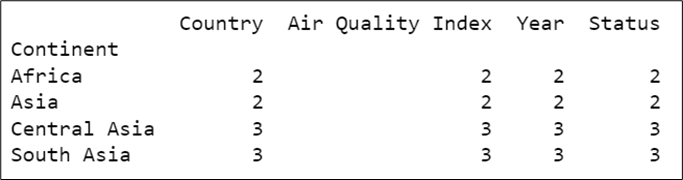
Notice that in the output above we see the grouped data with indexes, now let’s show it in the table:
# Showing the groups in the table using 'count' method
print(cont.count())
Output:
This was all about how to group DataFrame based on one column. Let’s proceed with the grouping based on multiple columns.
Creating group of two columns #
Now we will create groups based on Status and Continent as shown below:
# Grouping data by two columns 'Status' and 'Continent'
AQ = df.groupby(['Status','Continent'])

# Printing grouped data
print(AQ.groups)
Output:
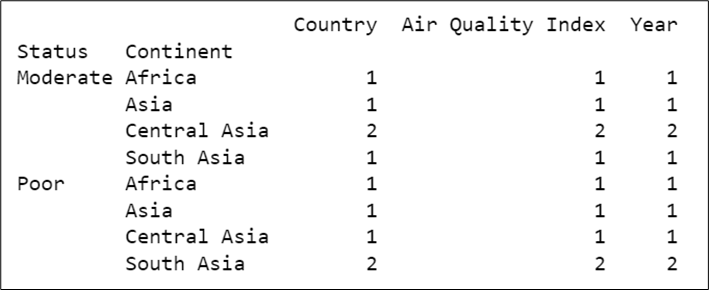
{('Moderate', 'Africa'): [5], ('Moderate', 'Asia'): [6], ('Moderate', 'Central Asia'): [7, 9], ('Moderate', 'South Asia'): [8], ('Poor', 'Africa'): [1], ('Poor', 'Asia'): [4], ('Poor', 'Central Asia'): [3], ('Poor', 'South Asia'): [0, 2]}To show it in the table using ‘count’ method like in the code below:
# Showing the groups based on two columns in the table using 'count' method
print(AQ.count())
Output:
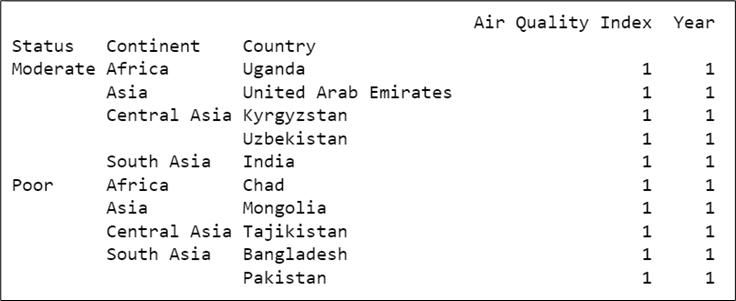
Grouping by three columns #
Use the same idea for the grouping by three columns and show grouped data in the table.
# Grouping data by three columns 'Status','Continent' and 'Country'
AQ = df.groupby(['Status','Continent','Country'])

# Printing grouped data using ‘count’ method
print(AQ.count())
Output:
Getting a specific group #
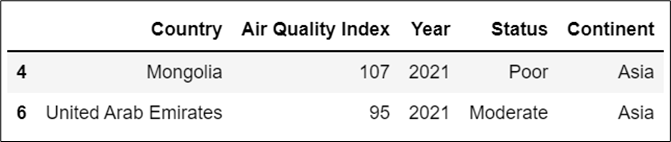
We can access to specific group by using get_group method. Let us now get acess to the group Asia using this method.
# Calling 'get_group' method to access a specific group from all the groups
groups.get_group('Asia')
Output:
The get_group method can also be used for multiple groups as well as shown below:
# Creating groups by two columns
groups = df.groupby(["Continent","Status"])
# Calling 'get_group' method to access to two grouped columns values
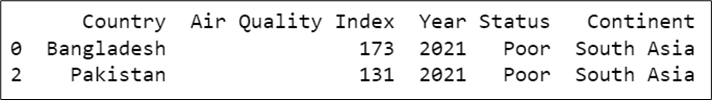
asia = groups.get_group(("South Asia","Poor"))
# Printing the result
print(asia)
Output:
The results show us that we printed only countries with the “Poor” status from the “Continent” group’s column “South Asia”.
We can also apply different aggregations to a specific group as well using the same get_group method and any other aggregation functions. Let us find the mean of the Air Quality Index column in group Asia.
# Calling 'get_group' method to access a specific group from all the groups
asia = groups.get_group('Asia')

# Applying mean() function to the specific column
mean = asia['Air Quality Index'].mean()

# Printingthe mean
print("Air quality index's mean value of Asia is", mean)
Output:

Groupby output format #
The output of groupby and aggregate operations differs between Pandas Series and Pandas DataFrames, which can be confusing. Typically, if you compute the result with more than one column, your result will be a data frame. For single-column results, aggregation functions will generate a series by default. We can change this setting by selecting a different operation column:
# Producing Pandas Series
# Using 'mean()' method to find the average air quality index for each continent
# Rounding the mean using 'round()' function
round(df.groupby('Continent')['Air Quality Index'].mean(), 1)
Output:
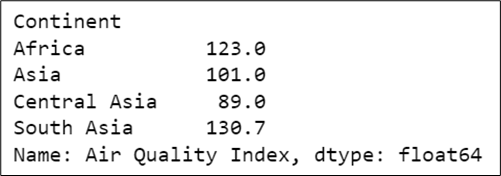
Output in this case is in Pandas Series. Now let’s try to get Pandas DataFrame as a result:
# Producing Pandas DataFrame
# Using 'mean()' method to find the average air quality index for each continent
# Rounding the mean using 'round()' function
round(df.groupby('Continent')[['Air Quality Index']].mean(), 1)
Output:
This way we can get different output formats depending on our request.
Iterating through groups in pandas groupby #
We already know how to use pandas groupby function with one and multiple groups (columns), which is returning pandas object which is iterable. Now let’s iterate through the objects using ‘for’ loop and print the data.

# Impoting pandas
import pandas as pd

# Openning dataset
df = pd.read_csv("AQ.csv")

# Creating group based on one column using pandas groupby method
groups = df.groupby("Continent")

# Iterating over groups using for loop
for continent, value in groups:
    print(continent)
    print(value)
Output:
Now let’s see what the result will be if we will iterate through two groups:
# Creating group based on two columns using pandas groupby method
groups = df.groupby(["Continent","Status"])

# Iterating over groups using for loop
for continent, value in groups:
    print(continent)
    print(value)
Output:
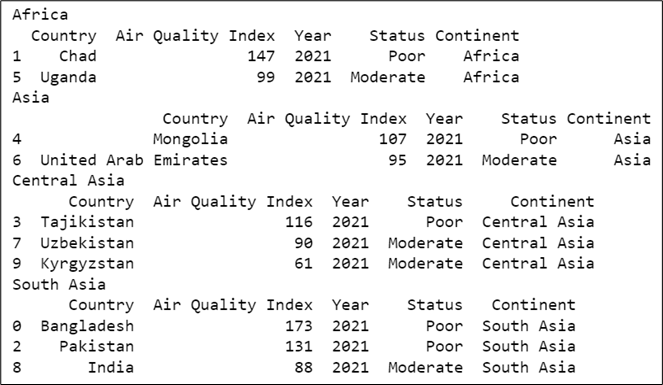
In the same way, let’s try to use for loop for the three groups.
# Creating group based on three columns using pandas groupby method
groups = df.groupby(["Continent","Country","Status"])

# Iterating over groups using for loop
for continent, value in groups:
    print(continent)
    print(value)
Output:
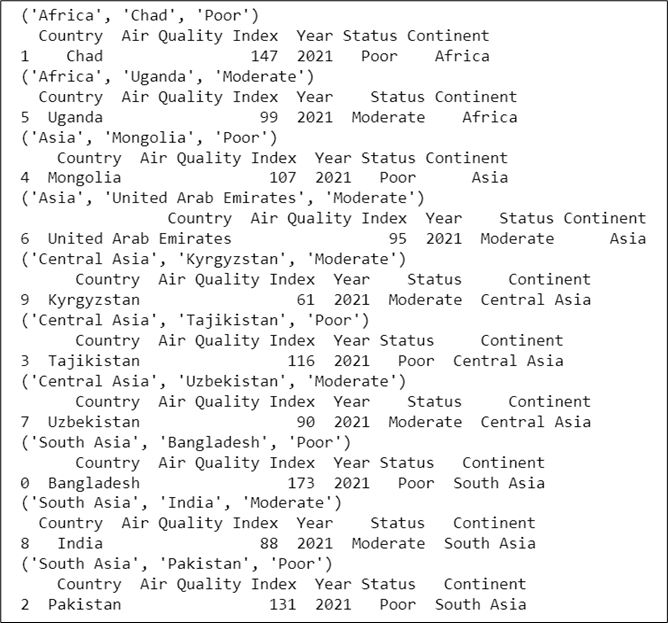
That was all about using for loop through one and multiple columns.
Finding the percentage of grouped data #
Moreover, we can use different functions using our grouped data. For example, let’s use lambda function to see the percentage of the grouped by one or multiple columns data.
# Creating groups by three columns
# Applying 'size()' property to represent the number of elements in this object
groups = df.groupby(["Continent","Status"]).size()

# Calculating the percentage on the level of status for each continent using lambda function
perc = groups.groupby(level=0).apply(lambda x:100*x/float(x.sum()))

# Showing the result
print(perc)
Output:

Different built-in functions #
Up to this point, we used mean, count, and other functions, which are built-in Pandas aggregation, but they’re not the only ones. The following table summarizes some other built-in Pandas aggregations:
| Aggregation | Description |
| count() | Total number of items |
| first(), last() | First and last item |
| mean(), median() | Mean and median |
| min(), max() | Minimum and maximum |
| std(), var() | Standard deviation and variance |
| mad() | Mean absolute deviation |
| prod() | Product of all items |
| sum() | Sum of all items |
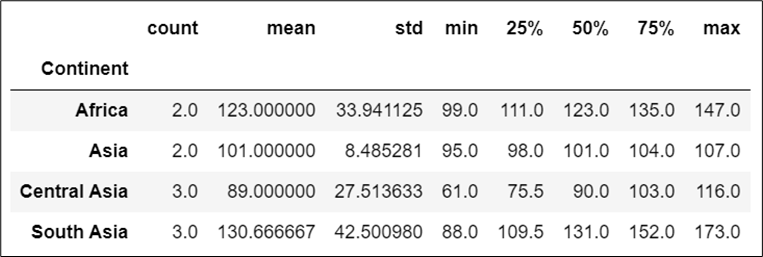
For example, we can use describe to get the descriptive statistic of our data.
# Using describe function over each continents' air quality indexes
df.groupby('Continent')['Air Quality Index'].describe()
In this code, we’re using [‘Air Quality Index’] to specify over which group we want to apply describe function.
Output:
Before it, we mostly were using built-in functions separately like mean(), sum(), etc, but groupby objects have aggregate(), filter(), transform(), and apply() methods that easily execute a bunch of useful operations before combining the grouped data.
Aggregation #
The aggregate() method allows us to use several different aggregations and compute all of them at once.
For example, we can apply min(), max() and mean() methods on our grouped data.
# Importing pandas
import pandas as pd

# Importing numpy
import numpy as np

# Using multiple aggregations like min(),mean(),max()
agg = df.groupby(["Continent","Year"]).agg([np.min,np.mean,np.max])

# Printing the result
print(agg)
Output:
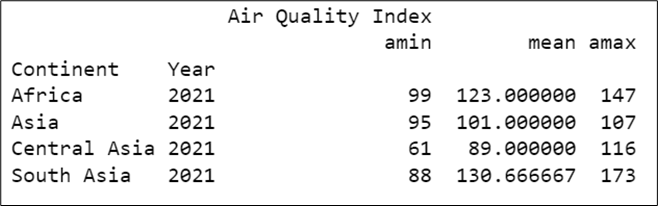
In the output, we see that we implemented three functions at once to get minimum, mean, and maximum values of the air quality index for each continent.
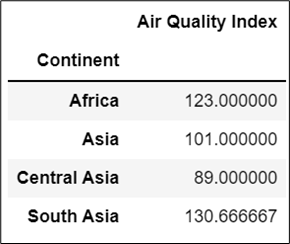
Filtering #
The filter() operation allows us to discard data based on group properties. For example, we may want to keep only one needed group with some needed properties. Let us get access to the continent by using filter() method and find the mean of each continents’ Air Quality Index.
# Importing pandas
import pandas as pd

# Reading dataset
df = pd.read_csv("AQ.csv")

# Applying filter() method to our dataset
groups = df.filter(['Continent', 'Air Quality Index'])

# Gtouping the continent
groups.groupby("Continent").mean()
Output:
Transformation #
The transform() function returns a transformed version of the entire data for the recombination. The output result has the same form as the input before.
# Defining function of square
def function(x):
    return x**2

# Getting air quality index from a data frame
AQI = df['Air Quality Index']

# Using transfor function over air quality index
print(AQI.transform(function))
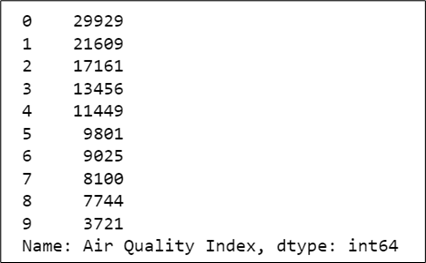
Output:
Apply #
Apply() function allow us to apply various of other functions to the groups. For example, we can apply different functions on the specified grouped data as shown below:
AQI = df.groupby(['Continent'])['Air Quality Index'].apply(lambda x: x - x.min())
print(AQI)
Output:

Saving grouped DataFrame in different formats #
In the last section of this tutorial, we’re going to learn how to convert our groupby to CSV and Excel files.
First of all, we have to reset our indexes for both of the types of savings the data. To save our data as a CSV file we will use to_csv method. See the example below:
# Importing pandas
import pandas as pd
# Reading our datset
df = pd.read_csv("AQ.csv")
# Grouping by the continent
groups = df.groupby(['Continent'])
# Resetting index and finding size of the elements in each continent
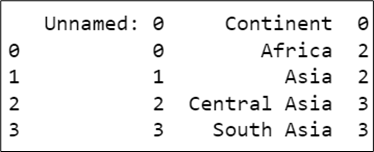
my_df = groups.size().reset_index()
# Converting groupby to csv file using to_csv function
my_df.to_csv("grouped_file.csv", index = True)
# Checking saved file
check = pd.read_csv("grouped_file.csv")
print(check)
Output:
To save our data as an Excel file we will use to_excel method. See the example below:
# Importing pandas
import pandas as pd
# Reading our datset
df = pd.read_csv("AQ.csv")
# Grouping by the continent
groups = df.groupby(['Continent'])
# Resetting index and finding size of the elements in each continent
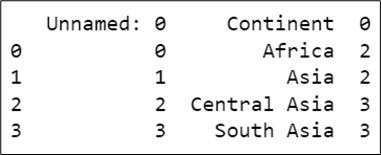
my_df = groups.size().reset_index()
# Converting groupby to excel file using to_xlsx function
my_df.to_excel("grouped_file.xlsx", index = False)
# Checking saved file
check = pd.read_csv("grouped_file.csv")
print(check)
Output:
Summary #
In this tutorial, we looked at the groupby function that divides our data into different groups of our choice. The output of which is iterable, which means that we can iterate separately over the groups by applying different functions. We also looked at how we can select a special group and how to iterate over them. We have also looked at how to use a variety of aggregations on one or more groups, and finally, we learned how to save our data as CSV or Excel files.
A complete copy of the source code can be found on GitHub How to work with pandas groupby method


